But being able to analyze data also requires the use of visualizations to discover insights out of the data and be able to socialize them with colleagues and managers. The importance of Self Service Business Intelligence is not only exploratory. The ability to share and socialize information is a must in the data analysis process. Data Scientists exists for decades, even though it is a “vogue” term nowadays in every modern organization, the reality is that vast amounts of data always existed in fields like medicine, drug discovery, microbiological sciences, advanced finance, and biotech. The field is mature enough to produce a set of best practices that have to do on how data is shown to non-scientific audiences, in a way that the insights obtained are understood and can help to the persuasion of an idea.
A Three-level Decision Tree for Selecting the Perfect Visualization for Your Data
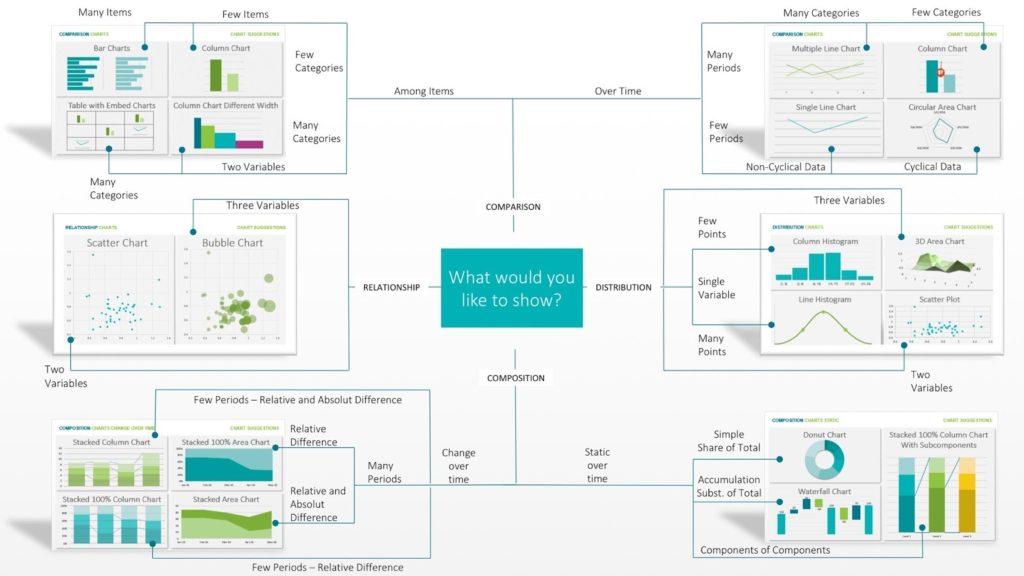
In this article, we are showing a simple cheat sheet called the Chart Suggestions—A Thought-Starter from The Extreme Presentation™ Method created by Dr. Andrew Abela.
Selecting the perfect visualization
The Abela’s Cheatsheet provides a general overview, which starts with a simple question: What would you like to show? The answer provides a decision tree to follow and determine the kind of visualization of the data you can use.
For the diagram, we are using Abela’s Chart Chooser PowerPoint Templates from SlideModel as it allows users to download the template and edit data-driven charts directly in PowerPoint. The four main decision tree branches are based on the purpose of the perfect visualization:
Relationship Comparison Distribution Composition
On each node, the questions focus on the nature of the information (static or dynamic), the number of variables involved, and the series and categories. The following section deep dives in each branch of the tree and presents some examples.
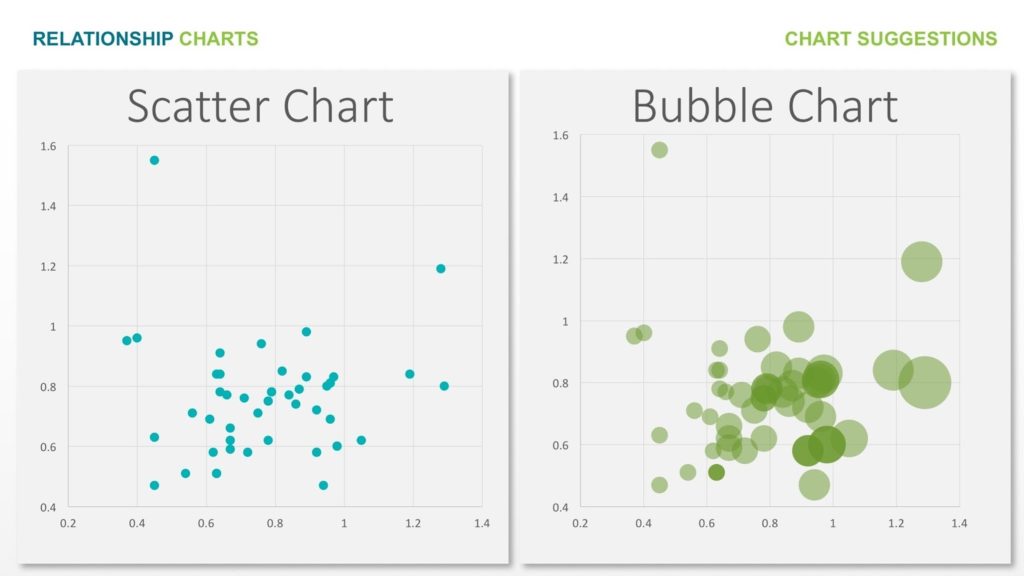
Relationship
When the purpose of the chart is to show the relationship between variables of data or to infer some relationship insight, the cheat sheet proposes two charts:
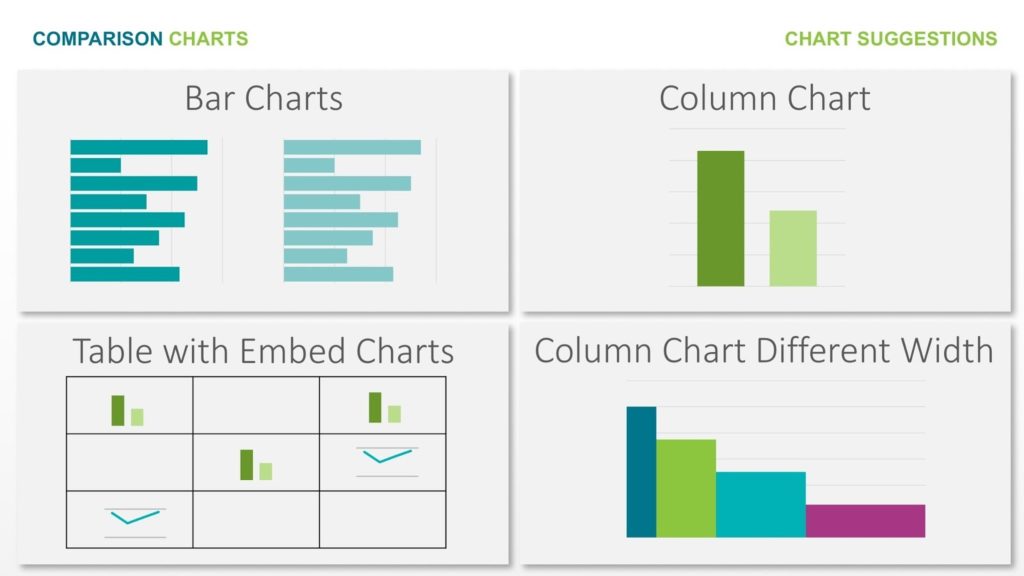
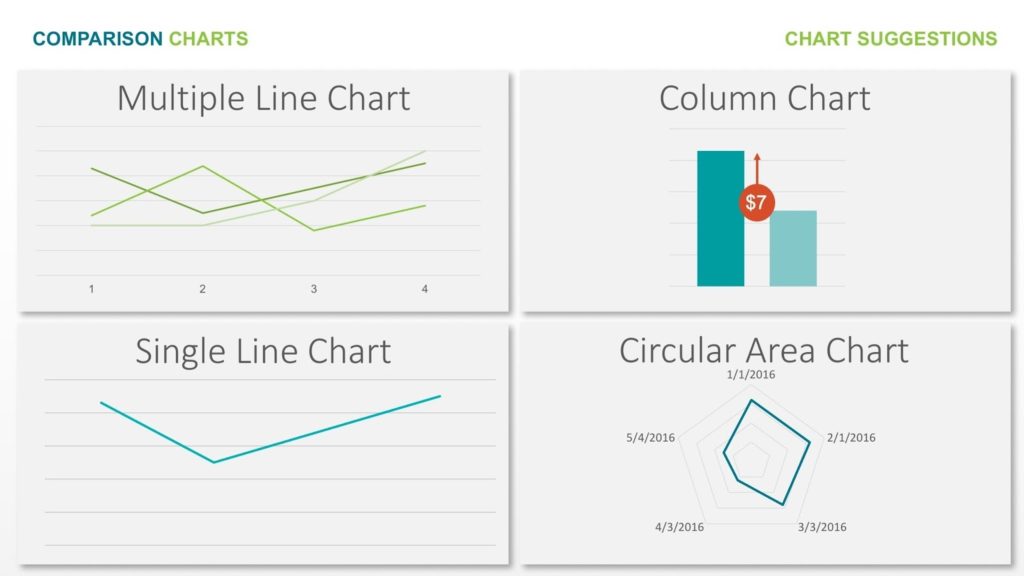
Comparison
The comparison chart selection decision tree branch starts with the option of comparison of items vs. comparison over time.
Comparing among items
Comparing through time
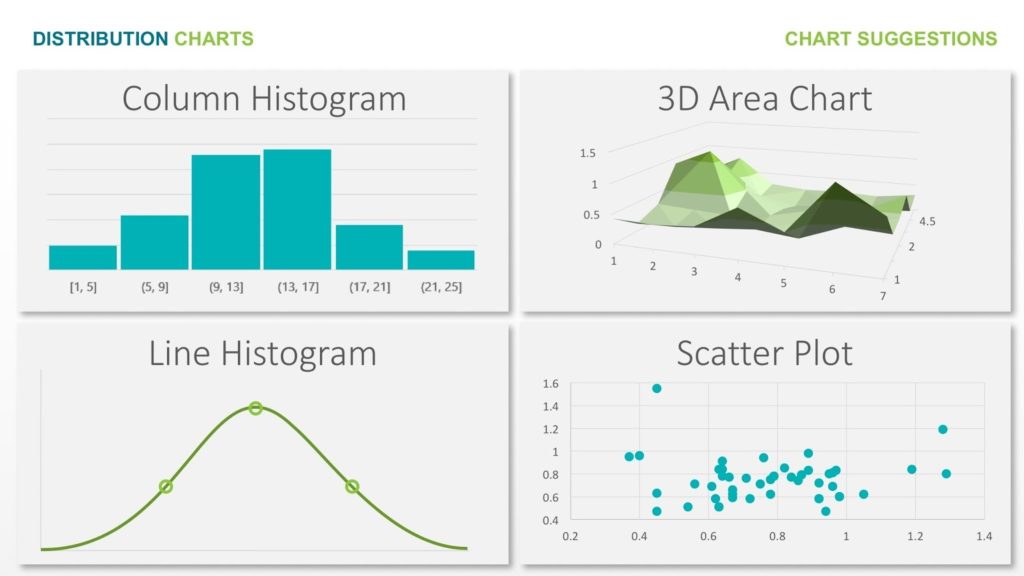
Distribution
The distribution chart selection decision tree branch first level divides between one variable or multiple variables.
Composition
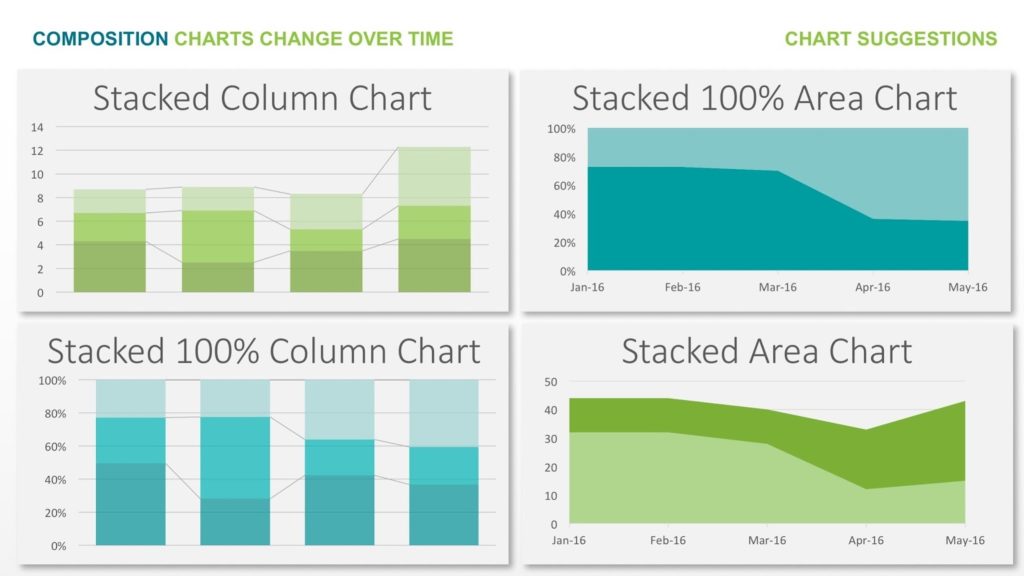
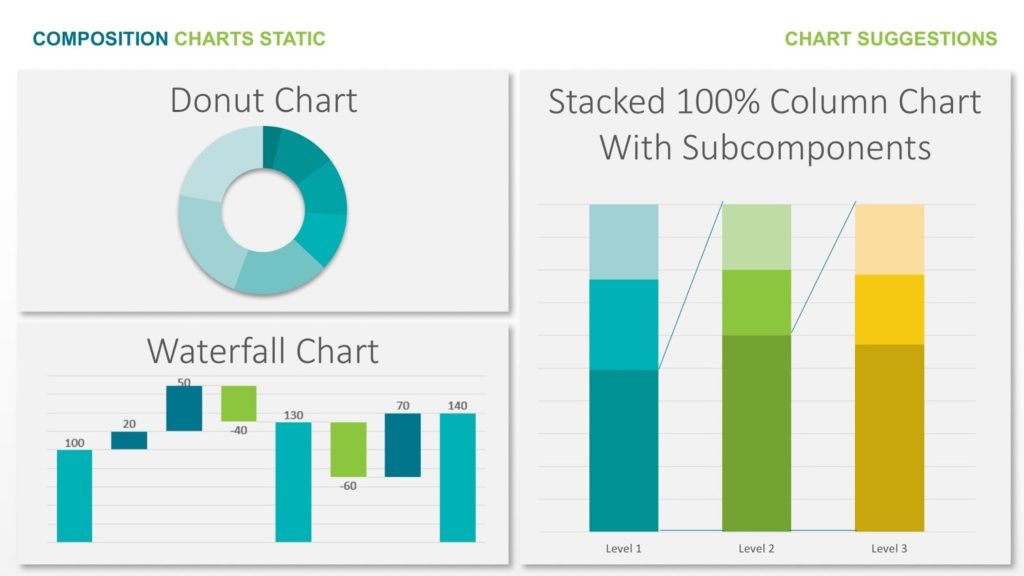
The composition chart selection decision tree divides into two main branches, the composition over time, and the composition static (a photo).
Composition Dynamic Over Time
Composition Static Over Time
When we talk about composition static in time, we are referring a chart that shows a photo os a certain moment in time and expresses the components of a whole value.
Conclusion
The Chart Chooser From Abela’s Extreme Presentation Method is a useful tool for generating chart ideas and prototype different versions of the perfect visualization during data analysis. The cheat sheet is not a complete assessment, and its intention is not to be thought of as a static reference but to be considered an exploratory tool for trying different charts throughout your analysis.